How to Calculate Break Even Point Like a Top Consultant
Learn how to calculate break even point in units and sales. This guide provides the formulas, examples, and expert insights needed for consulting interviews.

Let's get straight to it: the break-even point is the magic number where your total revenue equals your total costs. You're not making money yet, but you're not losing it either. It’s the baseline for survival, and for anyone aiming for a career in consulting, understanding it isn't just helpful—it's absolutely essential for cracking those tough profitability case interviews.
Why Break-Even Analysis Is a Consultant's Core Skill

When you're in an interview with a firm like McKinsey, BCG, or Bain, they're not just testing your math skills. They're evaluating your ability to think strategically. Break-even analysis is your tool to quickly answer the most critical question any business faces: Is this idea even viable?
It’s how you cut through the noise. With a quick calculation, you can determine if a new product has a shot, figure out how a price cut will impact the bottom line, or pinpoint exactly how much more efficient an operation needs to be to become profitable.
The beauty of the analysis is its reliance on just a few core numbers. To get started, you'll need to pin down the key components that drive the calculation.
Key Components of Break-Even Analysis
Here’s a quick rundown of the essential inputs you’ll need to master. Think of these as the building blocks for any break-even calculation you'll encounter.
| Component | Definition | Example |
|---|---|---|
| Fixed Costs | Expenses that stay the same regardless of how much you produce or sell. | Rent, salaried employee pay, insurance, software subscriptions. |
| Variable Costs | Costs that change in direct proportion to your production or sales volume. | Raw materials, direct labor for production, shipping costs per unit. |
| Selling Price | The price you charge a customer for a single unit of your product or service. | The $5 price tag on a cup of coffee. |
Once you have a handle on these three inputs, the analysis itself becomes second nature.
Mastering these components shows an interviewer you can do more than just crunch numbers; it proves you understand the fundamental mechanics of a business. That’s the kind of thinking they’re looking for.
This isn't just theory. You'll find this concept popping up in an estimated 70-80% of profitability case studies. Imagine you're analyzing a water bottle company. They have fixed costs of $100,000 (think rent and salaries), sell each bottle for $12, and it costs them $2 in materials and labor for each one. To break even, they need to sell exactly 10,000 units.
How did we get that? By dividing the fixed costs ($100,000) by the contribution margin per bottle ($12 - $2 = $10). Simple, powerful, and a must-know calculation. For a deeper dive into this foundational business metric, the resources at Wall Street Prep are an excellent starting point. Getting this down is your first real step toward thinking like a seasoned consultant.
Calculating Your Break-Even Point in Units and Revenue
Alright, you've got your costs sorted into fixed and variable buckets. Now for the fun part: putting those numbers to work. There are two primary ways to calculate your break-even point, and knowing which one to use—and when—is a key marker of a sharp analyst.
The choice really comes down to the kind of business you're looking at. For some, counting individual units is the most intuitive path. For others, it's all about the total sales dollars.
The Unit-Based Calculation
The most common approach, and probably the one you first learned, is finding the break-even point in units. This tells you exactly how many widgets, subscriptions, or coffees you need to sell to cover all your costs. It's the perfect metric for businesses with tangible, easy-to-count products, like a direct-to-consumer brand or a local bakery.
To get there, we first need to figure out the contribution margin for each unit. This is a crucial metric. It's what's left over from each sale after you've paid the variable costs for that specific unit. Think of it as the cash from each sale that can be put toward paying down your big, fixed costs.
The formula is beautifully simple:
Break-Even Point (Units) = Total Fixed Costs / (Selling Price Per Unit – Variable Cost Per Unit)
That piece on the bottom, Selling Price Per Unit – Variable Cost Per Unit, is your contribution margin per unit. The higher it is, the more power each sale has, and the faster you can get to break-even.
Let’s run the numbers for a hypothetical software startup selling a project management tool.
- Total Fixed Costs: $50,000 per month (this covers salaries, rent, servers, etc.)
- Selling Price Per Unit: $50 per subscription per month
- Variable Cost Per Unit: $10 per subscription per month (think customer support hours and data processing tied to each user)
First, the contribution margin is $40 ($50 price - $10 variable cost).
Now, plug it into the formula: $50,000 / $40 = 1,250 units. This startup has to sell 1,250 subscriptions every single month just to cover its baseline costs. The 1,251st subscription is where they start making a profit.
The Revenue-Based Calculation
But what if you're analyzing a business where "units" are tricky to define? This is common for consulting firms, agencies, or even complex SaaS platforms with a dozen different pricing tiers. In these cases, calculating the break-even point in revenue makes a lot more sense. This tells you the total sales figure you need to hit.
For this method, we lean on the Contribution Margin Ratio. Instead of a dollar amount per unit, this gives us a percentage. It shows what portion of each dollar of revenue is available to chip away at fixed costs.
- Contribution Margin Ratio = (Selling Price Per Unit - Variable Cost Per Unit) / Selling Price Per Unit
Once you have that ratio, the break-even formula is just as straightforward:
Break-Even Point (Revenue) = Total Fixed Costs / Contribution Margin Ratio
Let's stick with our software startup. Their Contribution Margin Ratio is $40 / $50 = 0.8, or 80%. This means for every dollar in sales, 80 cents goes toward covering fixed costs.
So, the revenue break-even point is: $50,000 / 0.8 = $62,500.
Being able to flip between these two calculations is a sign of true financial fluency. A freelance IT consultant, for example, might have $600 in monthly fixed costs and a contribution margin of $200 per project. They can quickly see they need to land three projects just to break even. This kind of quick, practical analysis is invaluable, especially as consultants increasingly work with tech and service-based clients. You can find more examples and applications for finance pros at HighRadius.com.
Building precise models like these is a core skill, and you can sharpen yours by reviewing our guide on 10 financial modeling best practices. And just as break-even analysis requires a sharp eye on your inputs and outputs, using a tool like an ROI Calculator can bring that same level of precision to measuring your marketing performance.
Turning Numbers into a Business Strategy
Crunching the numbers to find your break-even point is just the starting line. For any serious consultant or financial analyst, that number isn't the answer; it's the beginning of a conversation. The real magic happens when you interpret what that figure means for the business and use it to tell a strategic story. This is how you go from being a human calculator to a genuine business advisor.
A break-even chart is one of the best tools for telling this story visually. By plotting your total costs and total revenue against your sales volume, you can instantly see the financial health of the business on a single graph. The spot where those two lines cross? That’s your break-even point—the precise moment the company stops losing money and starts earning a profit.
This visual guide breaks down the two core formulas you'll need.
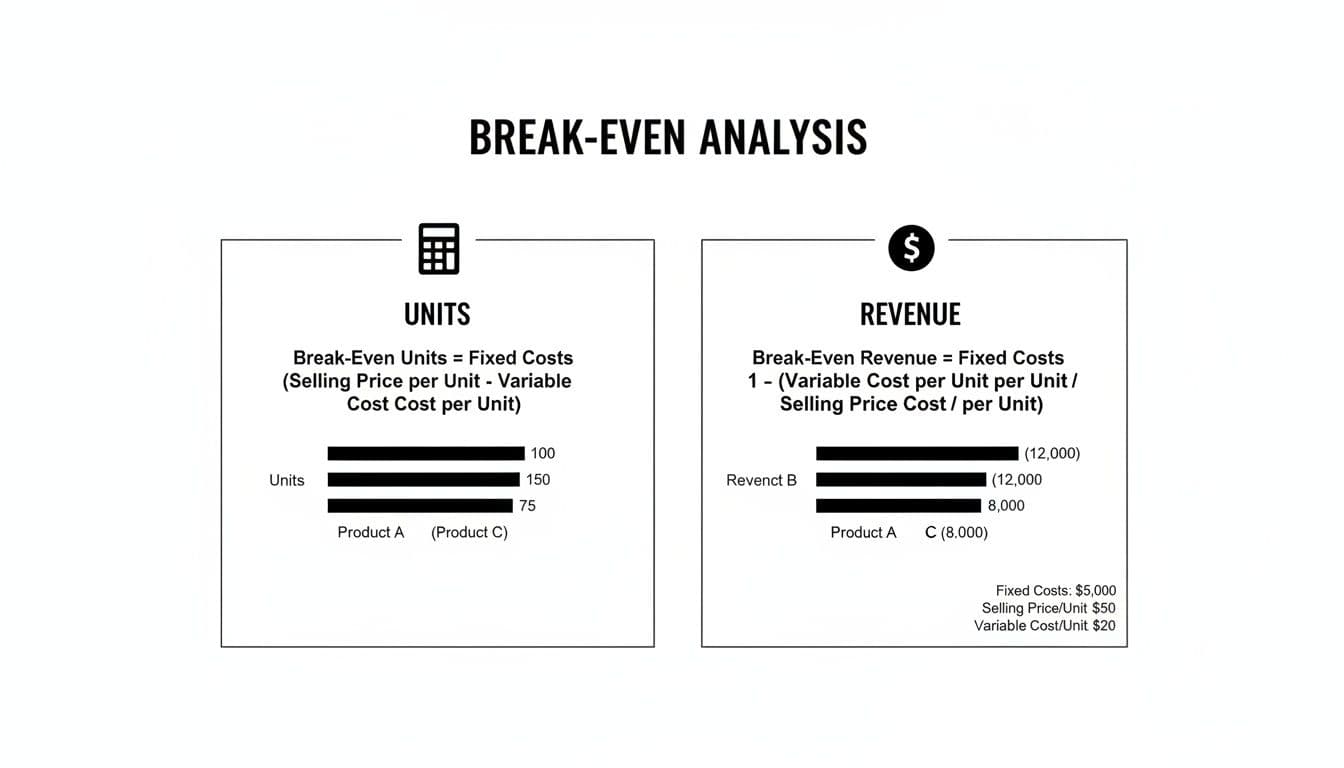
Notice how it separates the calculation for units from the one for revenue. This is a key distinction, as you'll use one or the other depending on what makes the most sense for the company's business model.
Finding Your Buffer: The Margin of Safety
The break-even chart shows more than just where you stop losing money. It also highlights another critical metric: the Margin of Safety. This is simply the difference between your actual (or forecasted) sales and your break-even sales. It’s your financial cushion.
Think of it as the answer to a crucial question every CEO worries about: “How much can sales fall before we're in the red?”
A wide margin of safety means the business is robust. It can handle a slow quarter, an unexpected price hike from a supplier, or a new competitor entering the market. A thin margin, on the other hand, is a red flag. It signals that even a minor dip in sales could plunge the company into losses.
Let's say your break-even point is 1,000 units a month, but you're currently selling 1,500 units. Your margin of safety is 500 units, which is 33.3% of your current sales. That’s a decent buffer. This kind of insight ties directly into the core financial strength of a business, which is a big part of understanding what is unit economics and how profit is truly generated.
When you're in a case interview, bringing up the Margin of Safety is a game-changer. It shows you're not just plugging numbers into a formula. It proves you're thinking strategically about risk, operational stability, and the overall resilience of the business—exactly what top firms are looking for.
When you frame your analysis around these concepts—using the chart for visualization and the Margin of Safety for risk assessment—you elevate your entire argument. It's no longer just a math problem; it's a compelling business recommendation. That's what separates a good candidate from one who gets the offer.
Using Sensitivity Analysis to Stress-Test Your Assumptions
Calculating a single break-even point is a solid start, but in the real world—and especially in a case interview—that number is just the beginning of the conversation. Prices fluctuate, costs creep up, and market dynamics shift. This is where sensitivity analysis becomes your most powerful tool. It’s all about asking "what if?" to see just how fragile or resilient your business model really is.
Think of it as stress-testing your assumptions. An interviewer wants to see more than your ability to plug numbers into a formula. They're testing your business acumen. Can you anticipate real-world pressures and understand their ripple effects on the bottom line? This is how you move from being a human calculator to a strategic advisor.
Modeling a Few Plausible Scenarios
Let's go back to our software startup, which needs 1,250 subscriptions to break even. Now, let’s see what happens when reality hits.
What if a key supplier hikes their rates? Or a new, aggressive competitor forces you to slash your prices?
Here’s how we can model a few of these common business curveballs:
-
Scenario 1: A Spike in Variable Costs. Imagine the provider for your cloud servers (a classic variable cost) raises its prices by 20%. This pushes your variable cost per subscription from $10 to $12. Your contribution margin immediately shrinks from $40 down to $38. Running the numbers again, your new break-even point is
$50,000 / $38, which is roughly 1,316 subscriptions. Suddenly, you have to find 66 more customers every single month just to cover your costs. -
Scenario 2: A Forced Price Cut. A scrappy competitor enters the market, and you're forced to drop your monthly price by 10% just to stay competitive. Your new price is $45. Now, your contribution margin falls to $35 ($45 price - $10 variable cost). Your break-even point balloons to
$50,000 / $35, or about 1,429 subscriptions. That's a huge jump—you now need to acquire almost 200 additional subscribers. -
Scenario 3: A Strategic Operational Shift. What if you invest in automation software? Let's say this increases your fixed costs by $5,000 per month, but it also slashes your variable support cost per user in half, from $10 to just $5.
- New Fixed Costs: $55,000
- New Contribution Margin: $45 (from the $50 price - $5 new variable cost)
- New Break-Even Point:
$55,000 / $45, which comes out to about 1,222 subscriptions.
This last scenario is where the real strategic thinking comes in. Even though the company's fixed costs went up, the investment actually lowered the break-even point. This makes the business more profitable on every single customer acquired beyond that new, lower threshold.
This is your moment to shine in an interview. Don't just state the new number. Interpret it. You could frame it like this: “While the upfront investment increases our fixed cost base, the improved contribution margin lowers our break-even point and accelerates profitability on each new customer. This suggests the investment is sound if we are confident in achieving sales volumes above 1,222 units.”
How to Frame Your Analysis
When your interviewer lobs a follow-up question like, "Okay, now what happens if your material costs increase?" they're testing your ability to connect the dots. They don't just want a new number; they want the implication.
Instead of just stating the result, explain what it means for the business.
For example, you could say, “A 10% increase in variable costs would raise our break-even point from 1,250 units to 1,316 units. This is a 5% increase in the sales volume we need to hit just to stay out of the red. More importantly, it narrows our margin of safety and makes the business more sensitive to even small dips in monthly sales.”
That kind of analysis shows you're not just crunching numbers—you're thinking like a strategist.
Navigating the Tricky Spots: Common Break-Even Pitfalls
Knowing the formula is just the start. The real test, especially in a high-pressure situation like a case interview, is applying it correctly without falling into common traps. Even the sharpest candidates can get tripped up, so let's walk through what to watch out for.
The Slippery Slope of Cost Classification
The biggest and most frequent mistake I see is misclassifying costs. The line between fixed and variable can get blurry fast.
For example, a sales commission is a textbook variable cost. But what about the salesperson's base salary? That's fixed. Lumping them together or getting it wrong will throw off your entire calculation from the very beginning.
Then you have the sneaky ones: semi-variable costs. Think of a utility bill—it often has a fixed base service fee, plus a variable charge that goes up with usage. You have to decide how to handle these, and the first step is recognizing they exist.
Assumptions Will Make or Break Your Analysis
A perfect calculation based on a bad assumption is worse than useless—it's misleading. Before you even touch a calculator, you absolutely must clarify the ground rules. This isn't just about getting the right answer; it's about showing the interviewer you're a thorough, structured thinker.
Here are the kinds of questions I’d be asking:
- On Costs: "How is the sales team paid? Is it all commission, a base salary, or a mix? I need to know this to properly classify their compensation."
- On Timeframe: "Are these fixed costs monthly or annual? That will define the period for our break-even point."
- On Volume: "Are we assuming everything we produce gets sold in the same period? Or do we need to account for inventory carryover?"
- On Pricing: "Is the price per unit consistent, or do you offer volume discounts? A changing price point will impact our revenue assumptions."
Never forget: Probing your assumptions isn't a sign of weakness. It's the hallmark of a great consultant. Interviewers would much rather you spend a minute clarifying things upfront than watch you build a brilliant analysis on a foundation of sand.
Ignoring these details can completely sink your case. For instance, the "produced vs. sold" issue is a classic trap. If a factory makes 10,000 widgets but only sells 8,000, it has already paid the variable costs for all 10,000. But the revenue only reflects the 8,000 sold. That mismatch dramatically changes the real break-even point.
Likewise, if volume discounts kick in, your average selling price drops, which means you suddenly need to sell a whole lot more just to cover your costs. Spotting these potential issues before you start the math is what separates a good answer from a great one.
Putting Your Knowledge to the Test with Practice Cases

Alright, you’ve got the theory down. Now comes the real test. Let's walk through a couple of classic scenarios you’d likely encounter in a case interview.
Remember, getting the final number is only half the battle. The real skill is in how you frame your approach, communicate your steps clearly, and, most importantly, explain what that number actually means for the business. That's the "so what?" that separates a good candidate from a great one.
This is where the rubber meets the road. Let’s jump in.
Case 1: A New Product Launch for a Manufacturer
The Setup: Your client, "AcuBlade," makes high-end kitchen knives. They're about to launch a brand-new chef's knife and have brought you in to figure out how many they need to sell in the first year just to cover their costs.
Here's the data they've handed you:
- Total Fixed Costs (Year 1): $500,000. This covers everything from the marketing launch and new machinery to the salaries for the dedicated production team.
- Selling Price Per Knife: $150.
- Variable Cost Per Knife: $50, which includes the steel, handle materials, and the direct labor to put it all together.
Your job is to find the break-even point in units for year one.
The Solution and Business Insight
First things first, let's lay out the logic. The question is about units, so that's the formula we'll use.
The first step is always to find the contribution margin per unit. This is the slice of profit from each sale that goes directly toward paying down those big fixed costs.
$150 (Selling Price) - $50 (Variable Cost) = $100
With a $100 contribution margin per knife, we can now figure out how many we need to sell to cover the $500,000 in fixed costs.
$500,000 (Fixed Costs) / $100 (Contribution Margin) = 5,000 units
The Insight: AcuBlade has to sell exactly 5,000 knives in its first year just to get back to zero. Every knife sold after that—starting with number 5,001—is pure profit. The immediate follow-up question for the client is: Is selling 5,000 units realistic? This pushes the conversation toward market sizing, competitive landscape, and their sales strategy.
Case 2: A SaaS Startup's Profitability Hurdle
The Setup: Now for a different flavor. Your client is "ConnectSphere," a B2B SaaS startup with a communication platform. They're burning cash and need to know what their monthly recurring revenue (MRR) target should be to finally hit profitability.
Here are their monthly numbers:
- Total Fixed Costs: $80,000 (This is mostly salaries, rent, and software licenses).
- Average Revenue Per Customer: $200/month.
- Average Variable Cost Per Customer: $40/month (Think server costs, customer support time, and data processing fees that scale with usage).
This time, you need to calculate the break-even point in revenue.
The Solution and Strategic Implications
For a subscription business like this, revenue is the north star metric. So, the revenue-based break-even formula makes the most sense.
We'll start by calculating the contribution margin ratio. This tells us what percentage of every single dollar of revenue is left over to cover their fixed costs.
- First, the Contribution Margin per customer:
$200 - $40 = $160 - Now, the Contribution Margin Ratio:
$160 / $200 = 0.8or 80%.
That means for every dollar ConnectSphere brings in, 80 cents is available to pay down their $80,000 fixed cost base.
$80,000 (Fixed Costs) / 0.8 (Contribution Margin Ratio) = $100,000
The Strategic Implication: ConnectSphere needs to hit an MRR of $100,000 to stop losing money. This single number transforms their strategy. It’s no longer an abstract goal; it's a concrete target. You can take it a step further: how many customers is that?
$100,000 / $200 per customer = 500 customers. Now the marketing and sales teams have a clear, actionable goal to shoot for.
If you want to tackle more complex business problems, you can find additional practice cases for McKinsey-style interviews to sharpen your skills.