How to Find Variable Cost for Accurate Business Analysis
Learn how to find variable cost using proven methods like account analysis, the high-low method, and regression for better financial modeling and analysis.

Calculating variable cost is more than just an accounting exercise; it's the key to understanding a company's real operational health, its pricing power, and its path to profitability. This is where you isolate the expenses that move in lockstep with production—think raw materials or sales commissions—from the steady, unchanging costs like rent. Getting this right turns theory into a powerful business tool.
Why Finding Variable Cost Is Your Analytical Superpower
Picture this: you're in a final-round consulting interview, and the case is a company with shrinking profit margins. Where do you start? The smart move is to deconstruct their cost structure. Your ability to swiftly and accurately pinpoint the variable costs is what separates a generic, textbook answer from a game-changing insight. This isn't just about crunching numbers; it's about strategic thinking.
Mastering this skill is fundamental. It lets you build robust financial models, conduct sharp due diligence, and offer up the kind of actionable recommendations that not only impress interviewers but also drive real-world results. For anyone serious about a career in consulting, analysis, or finance, this is a non-negotiable part of your toolkit.
The Foundation of Strategic Decisions
Getting a handle on business expenses is crucial, and a solid calculation of variable costs is foundational to understanding major overheads like your Inventory Carrying Cost. Think of variable costs as the pulse of a company’s operational efficiency. They have a direct impact on several critical areas:
- Pricing Strategy: Trying to set a price without knowing your variable cost per unit is like flying blind. That number sets the absolute floor—the minimum you have to charge just to avoid losing money on every single sale.
- Profitability Analysis: This is how you calculate the contribution margin, a potent metric that tells you exactly how much cash from each sale is left over to cover your fixed costs and, ultimately, generate profit.
- Break-Even Analysis: You can't figure out how many units you need to sell to turn a profit until you’ve cleanly separated your variable costs from your fixed ones.
Knowing how to find variable cost is the difference between simply reporting on a business's health and being able to actively improve it. It is the starting point for almost every meaningful operational and strategic recommendation.
In this guide, we'll walk through practical, interview-tested methods—from digging into the accounting details to running a quick high-low calculation on the fly. By mastering these techniques, you'll be ready to analyze any business from the ground up. To see how this fits into the bigger picture, you can dive deeper in our complete guide to what is unit economics, which explains how the profitability of one transaction scales into overall business success.
Get Your Hands Dirty with the Account Analysis Method
If you're the type who likes to roll up your sleeves and dig into the details, the account analysis method is for you. It's the most hands-on way to find variable costs, and frankly, it's my preferred starting point.
This approach isn't about fancy formulas. It’s about putting on your detective hat, systematically combing through a company's general ledger, and using your business judgment to classify each expense account as variable, fixed, or mixed. This is a killer skill to have, especially in a case interview where demonstrating commercial acumen is everything.
You're essentially building a cost structure from the ground up, one line item at a time. Some costs are dead giveaways. Direct materials? Classic variable cost. The more you make, the more you buy. Sales commissions are another easy one, as they’re directly tied to revenue.
This decision-tree flowchart really drives home how analyzing costs is the foundational step for bigger strategic moves like setting prices or figuring out your break-even point.
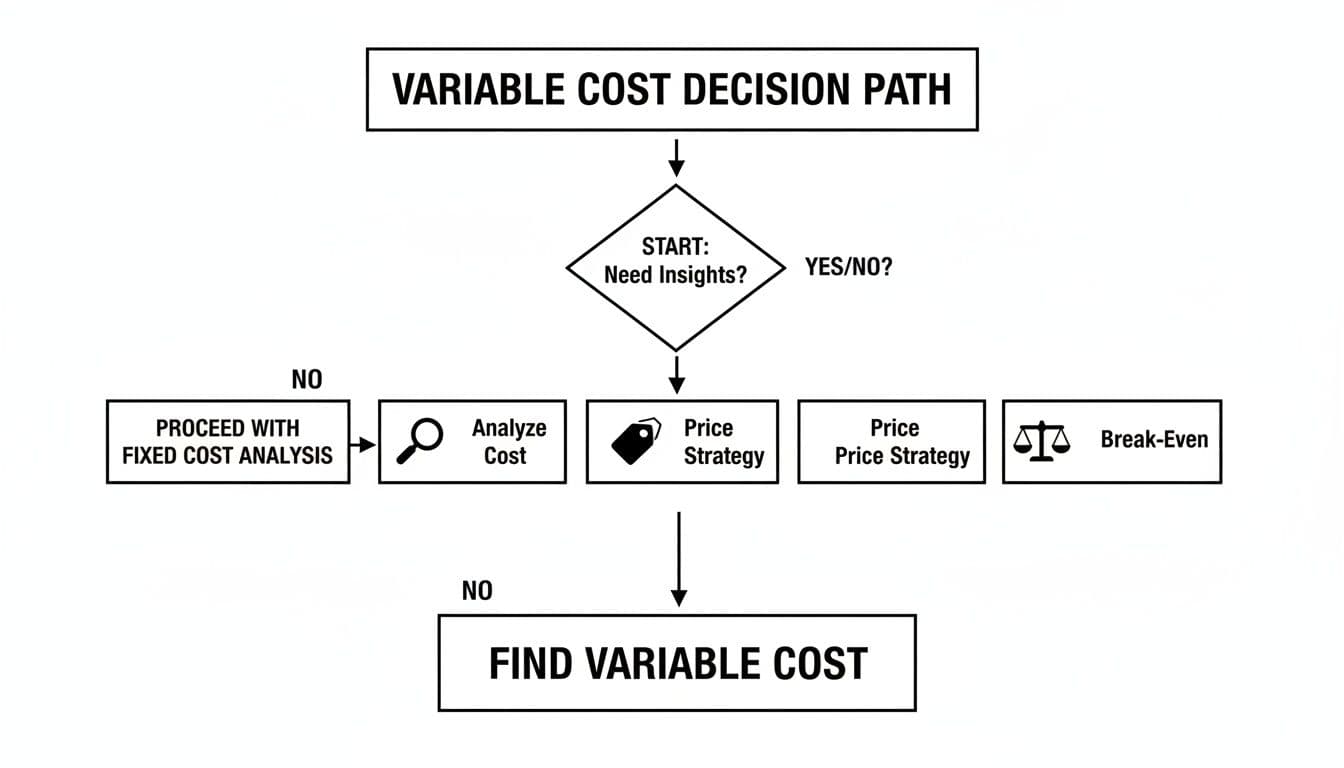
As you can see, once you’ve nailed down your costs, you can start making much smarter decisions about where the business is headed.
Wrestling with the Tricky Accounts
The real challenge—and where you can really shine—is in classifying those more nuanced accounts. Take the "utilities" line item. It’s tempting to just slap a "variable" label on it and move on, but that’s a rookie mistake. Most utility bills include a fixed monthly base fee plus a usage-based charge. This makes it a mixed cost, and it's your job to tease those two components apart.
Labor is another classic gray area. In U.S. manufacturing, direct labor can eat up anywhere from ~16% to 30% of total costs. This slice of the pie is highly variable, swinging with hourly wages, overtime during a production surge, or piece-rate incentives.
To help you get started with your own analysis, here's a quick cheat sheet for classifying common business expenses.
Common Variable vs Fixed Costs
| Expense Category | Typical Classification | Reasoning |
|---|---|---|
| Raw Materials | Variable | The cost scales directly with the number of units you produce. |
| Sales Commissions | Variable | Paid as a percentage of sales; no sales means no commission. |
| Shipping Costs | Variable | The more products you ship, the higher your total shipping bill. |
| Rent/Lease | Fixed | The payment is the same every month, regardless of business activity. |
| Salaries (Admin) | Fixed | Salaried employees are paid a set amount, not tied to production. |
| Insurance | Fixed | Premiums are typically paid on a set schedule (monthly, annually). |
| Utilities | Mixed | Often includes a fixed base charge plus variable usage costs. |
| Advertising | Fixed (Discretionary) | A set budget, though management can change it month to month. |
This table is a great starting point, but remember that context is king. Always think about how the business incurs the cost before making a final classification.
A Practical Walkthrough
Let's put this into practice with a small manufacturing company. Imagine you're reviewing their income statement, which is a core skill we cover in our guide on https://soreno.ai/articles/how-to-analyze-financial-statements.
Here’s how you might start bucketing their main expenses:
- Raw Materials: Definitely variable. More widgets mean more steel.
- Production Worker Wages: Variable. You need more labor-hours to meet higher demand.
- Sales Commissions: Purely variable. Tied directly to the sales reps' performance.
- Factory Rent: Fixed. The landlord gets paid the same amount no matter what.
- Administrative Salaries: Fixed. Your accountant's salary doesn't change with output.
- Factory Utilities: Mixed. Time to dig into those bills to separate the base fee from usage.
Once you’ve gone through every relevant line item, you just sum up everything you tagged as "variable" to get your total.
The real power of the account analysis method is its granularity. It forces you to think critically about every single dollar the company spends. You'll walk away with a much richer, more intuitive feel for the business than any high-level formula could ever give you.
If you’re working with a business that uses modern accounting software, this process gets a lot easier. Many platforms allow you to tag expenses as you record them, which can save a ton of time down the road. This guide on Identifying Fixed vs Variable Costs in Xero offers a great look at how this works in practice.
Sure, this method is more time-consuming. But the precision it delivers is almost always worth the effort, especially when you need to defend your numbers in a high-stakes meeting or a tough case interview.
Using The High-Low Method for Quick Estimates
When you're in a time-crunched case interview, you rarely get perfect data. This is where the high-low method becomes your secret weapon. It's a quick and dirty way to split mixed costs into their fixed and variable parts using just two data points: the periods with the absolute highest and lowest activity levels.
This approach is perfect when you need a fast, defensible estimate to build a quick Cost-Volume-Profit (CVP) analysis. Instead of getting bogged down in every single line item, you simply grab the two extremes from your dataset to isolate how costs change with activity. It’s a fantastic way to show you can handle imperfect information and still produce a logical, data-driven answer.

Unpacking The High-Low Formula
The logic behind this is surprisingly simple. Since fixed costs don't change with production volume, the entire difference in total costs between your busiest and quietest months must be driven by variable costs. That's the core idea.
The formula itself is just a reflection of this logic:
Variable Cost Per Unit = (Cost at Highest Activity - Cost at Lowest Activity) / (Highest Activity Level - Lowest Activity Level)
Let's break that down:
- The Numerator (the top part) is just the total change in your costs between those two extreme points.
- The Denominator (the bottom part) is the change in whatever is driving that cost—units produced, machine hours, miles driven, etc.
Once you nail down the variable cost for each unit, figuring out the fixed cost portion is straightforward. You just plug your answer back into the total cost equation using the data from either the high or the low point.
A Worked Example
Let's say you're analyzing a manufacturing client. At their peak output of 10,000 units, total costs hit $1,350,000. During a slow period, they produced only 5,000 units, and total costs were $775,000.
First, find the difference in cost and activity:
- Change in Cost: $1,350,000 - $775,000 = $575,000
- Change in Activity: 10,000 units - 5,000 units = 5,000 units
Now, just plug those numbers into the formula:
Variable Cost Per Unit = $575,000 / 5,000 units = $115 per unit
This kind of calculation is highly relevant today. Following the supply chain mess that started in 2020, many manufacturers saw variable labor costs jump 15-20% from overtime and higher wages needed to attract workers. You can see more on how labor costs fluctuate in the manufacturing sector in real-world data.
With our $115 per unit variable cost, we can now find the fixed costs. I’ll use the low-activity point data, but either works.
Fixed Costs = Total Costs - (Variable Cost Per Unit x Number of Units) Fixed Costs = $775,000 - ($115 x 5,000) = $200,000
So, our quick estimate gives us a fixed cost base of $200,000.
The high-low method's greatest strength is its simplicity. It provides a quick and easily explainable estimate of cost behavior, which is invaluable when time and data are limited. However, be aware that it only uses two data points and can be skewed by outliers.
Pinpointing Costs with Regression Analysis
When a quick estimate won't cut it, regression analysis is the most statistically robust tool in your kit. While the high-low method is useful for a back-of-the-envelope calculation, it relies on just two extreme data points. Regression, on the other hand, uses your entire set of historical data.
This is a game-changer for accuracy. By considering all data points, regression minimizes the distorting effect of any single outlier, giving you a much more reliable picture of your true cost structure.
In a consulting or finance interview, you probably won't be asked to perform a full regression on the spot. But just explaining the concept and how you'd use it demonstrates a deeper analytical rigor. It shows you know how to get the most precise answer when you have the data to back it up.
Start by Visualizing the Data
Before you even touch a formula, the first step is to see the relationship between your costs and production volume. The best way to do this is with a simple scatter plot.
Put your activity driver—like units produced or machine hours—on the horizontal x-axis. Then, plot your total costs on the vertical y-axis. Each dot on the resulting chart will represent the total cost for a specific period (say, a month) at that month's activity level.
Just by looking at the scatter plot, you can get an instant feel for the cost relationship. Do the dots generally form an upward-sloping line? If so, that's a great visual confirmation that your costs are behaving as expected, with a clear linear connection to your activity levels.
The Story Behind the Regression Equation
Once you have your scatter plot, regression analysis does the heavy lifting by mathematically drawing the "line of best fit" through your data points. This line is expressed by a clean, powerful equation:
y = a + bx
This formula is the key to unlocking your cost structure with precision. Here’s what it all means:
- y is your Total Cost.
- x is your Activity Level (e.g., units produced).
- b is the slope of the line. This is the number you're looking for—your variable cost per unit.
- a is the y-intercept, which is where the line crosses the vertical axis. This represents your total fixed costs.
The real beauty of regression is that it doesn't just give you a number; it mathematically defines the relationship between what you do and what it costs. The slope ('b') tells you exactly how much your costs will change with each additional unit of activity.
Finding Variable Cost in Excel
You don't need a PhD in statistics or fancy software to run a regression. Microsoft Excel has a couple of straightforward functions that get the job done.
First, set up your data with two columns: one for your activity level (your 'x' values) and one for your total costs (your 'y' values).
Then, you can use these simple formulas:
=SLOPE(known_y's, known_x's): This formula calculates the 'b' value from the equation, giving you the variable cost per unit.=INTERCEPT(known_y's, known_x's): This one calculates the 'a' value, which is your total fixed costs.
Getting comfortable with these two functions is a quick way to demonstrate not just that you understand the theory, but that you have the practical skills to pull a precise variable cost figure from a real-world dataset.
From Calculation to Strategy: What Your Variable Costs Really Tell You
Okay, so you've crunched the numbers and pinned down your variable costs. That’s a solid first step, but it’s just that—a first step. The real magic happens when you start using that data to make smarter business decisions. This is where you graduate from bookkeeper to strategist.

The bridge between raw data and actionable insight is a concept called contribution margin. Forget gross margin for a second; that can get muddied by allocated fixed costs. The contribution margin gives you a crystal-clear view of how much cash each sale generates to pay down your fixed expenses and, eventually, turn into profit.
Getting a Grip on Contribution Margin
The calculation itself is deceptively simple, but the perspective it provides is game-changing.
Contribution Margin Per Unit = Sales Price Per Unit - Variable Cost Per Unit
Let’s put that into a real-world context. Imagine you sell a high-end coffee maker for $100. The variable costs—parts, assembly labor, and shipping—add up to $40 per unit. Your contribution margin is $60.
This means every single coffee maker you sell drops $60 into the bucket. That bucket's first job is to cover your fixed costs like rent, salaries, and marketing budgets. Once that bucket is full, every extra $60 from each sale is pure, unadulterated profit. This is the shift in thinking that separates the best analysts from the rest. It changes the question from "What did we spend?" to "How does every sale fuel our business?"
The contribution margin cuts through the noise. It isolates the true economic performance of a product, showing you which items are actually funding your growth and which are just spinning their wheels.
Putting the Contribution Margin to Work
Once you have this number, you can start asking—and answering—the big strategic questions that really matter. It’s the bedrock of serious financial modeling.
Here are a few ways I’ve seen this play out:
- Pinpointing Product Profitability: Calculate the contribution margin for every product you sell. You'll quickly see which ones are your cash cows and which are duds. This is crucial for deciding where to focus your marketing dollars or whether it's time to retire a legacy product line.
- Running "What-If" Scenarios: Your key supplier just announced a 10% price hike on raw materials. How bad is the damage? Because you know your contribution margin, you can immediately calculate the hit to your per-unit profitability. This kind of forward-looking analysis is exactly what interviewers in consulting and finance want to see.
- Finding Your Break-Even Point: The contribution margin is the key ingredient here. Knowing how much each sale contributes makes it simple to figure out exactly how many units you need to move to cover your fixed costs. Our guide on how to calculate break-even point walks through this in detail.
Watch Out for These Common Traps
You can know all the formulas in the world, but applying them correctly when the pressure is on is a different ballgame. I've seen a lot of smart people stumble over a few common traps when trying to nail down variable costs.
The biggest mistake? Confusing average costs with true variable costs. It’s an easy error to make, but a costly one. Remember, an average cost often has fixed expenses baked into it, which will completely skew your view of per-unit profitability.
Another classic blunder is misclassifying your costs, especially those tricky mixed costs. Don't just lazily bucket "utilities" as entirely variable. There's almost always a fixed base fee, and failing to separate that will throw off your entire model. You also have to respect the relevant range—that sweet spot of normal operations where your cost assumptions are valid. If your production suddenly skyrockets, that neat variable cost per unit you calculated might not hold up as you lose economies of scale.
From Good Calculation to Great Analysis
Getting the number right is just the first step. To really impress in a consulting or finance interview, you need to turn that number into a strategic insight. Here are a few tips I've picked up over the years.
First, don't freeze up if you have incomplete data—it happens all the time in the real world. Make a reasonable assumption, but be loud and clear about it. Explain why you made that assumption. It shows you can think on your feet and apply structured logic to messy problems.
The most important thing you can do is a quick sanity check. Seriously, don't skip this. If you calculate a variable cost of $50 for a product that sells for $55, your alarm bells should be ringing. Pointing that out shows you’re a business thinker, not just a number cruncher.
Finally, get comfortable talking through your process. Don't just drop the final answer on the table. Walk your interviewer through the method you chose, the assumptions you made, and how you sanity-checked the result. This storytelling approach turns a simple calculation into a compelling piece of analysis, proving you can think critically and communicate like a leader. That's what separates the good analysts from the great ones.
Common Questions About Finding Variable Costs
Even with the right formulas, things can get murky when you're in the weeds of cost analysis. Let's tackle some of the most frequent questions that come up, especially when you're trying to apply these concepts to real-world scenarios.
What's The Real Difference Between Direct And Variable Costs?
It's easy to get these two mixed up because they often overlap, but they aren't the same thing. Think of it this way: a direct cost is tied to a specific product. It's the lumber in a specific model of chair. A variable cost, on the other hand, is any cost that simply fluctuates with your production volume.
Most of the time, direct costs are variable. But you can have indirect variable costs, like the electricity bill for a factory that makes ten different products. You can also have direct fixed costs, like the salary of a manager who only oversees the production line for that one specific chair model.
How Do I Handle Costs That Are Both Fixed And Variable?
These are called semi-variable or mixed costs, and they’re everywhere. Your company's utility bill or a salesperson's compensation package (base salary + commission) are classic examples. The trick is to split them apart.
This is exactly what the high-low method and regression analysis are designed for—they mathematically isolate the fixed and variable pieces. If you're doing an account analysis, you have to use your business sense. You’d look at that salesperson's comp plan and deliberately separate their fixed base salary from their variable commission, slotting each into the correct category in your analysis.
Being able to cleanly break down mixed costs is what separates a good analyst from a great one. It proves you know that real-world financials rarely fit into neat little boxes.
Which Method Should I Use In A Case Interview?
This is a great question, and the answer is always: "It depends on the data they give you." Your choice signals to the interviewer how you think.
- If you get a detailed expense list: Use Account Analysis. This is your chance to show off your business acumen by logically classifying each line item.
- If you get just two data points (e.g., total costs at two different output levels): The High-Low Method is your best bet. It’s fast, straightforward, and shows you can think on your feet.
- If you get a larger set of data points: Mention that you'd ideally use Regression Analysis. Even if you just eyeball the trend on a scatter plot, it shows you understand more sophisticated techniques for modeling cost behavior.
Ready to stop memorizing and start mastering? Soreno offers an AI-powered platform with over 500 cases and guided drills, helping you nail concepts like variable cost calculation under pressure. Get instant, rubric-based feedback and unlimited practice so you can walk into your interviews with total confidence. Start your 7-day free trial at Soreno.ai and feel the difference.