Mergers and Acquisitions Valuation: A Practical Guide for Finance Pros
Master mergers and acquisitions valuation with a concise, practical guide featuring real-world examples and key valuation methods.
At its core, M&A valuation is all about figuring out what a target company is truly worth. It's a blend of hard financial analysis and sharp strategic judgment, all aimed at landing on a price that makes sense for both the buyer and the seller. Get this right, and you have the bedrock of a successful deal.
Why M&A Valuation Is More Art Than Science

It’s tempting to think of valuation as a precise mathematical exercise, but that’s not the whole story. It’s much more like appraising a unique piece of art. The numbers give you the framework, but the final value is painted with shades of strategic fit, market mood, and future potential.
You’re not just valuing a company for what it is today, but for what it could become under new ownership. This process is the linchpin of any transaction, driving everything from the first offer to the final integration strategy. Ultimately, every deal comes down to two big questions.
The Two Core Questions in Valuation
First, what's the business worth on its own, as a standalone entity? This means getting your hands dirty with a deep dive into its financial health, cash flow, and competitive standing. To really nail this down, a solid understanding of the mergers and acquisitions due diligence process is non-negotiable.
Second, what extra value—or premium—can be justified by potential synergies? Synergies are the benefits you get from combining two companies, like slashing redundant costs or grabbing a bigger market share. This is where the "art" really kicks in, as you have to put a number on opportunities that don't even exist yet.
Valuation isn't about finding a single "correct" number. It's about establishing a defensible range of values that allows buyers and sellers to negotiate a deal that creates mutual benefit and long-term success.
The Foundation for Strategic Decisions
The stakes here are enormous. In 2025, global M&A activity roared back to life, with H1 deal value hitting $1.93 trillion and H2 climbing even higher to $2.03 trillion. This wasn't just a random spike; it was driven by a stabilizing economy and a strategic land-grab for AI-related assets, according to insights from A.O. Shearman.
This guide will walk you through the core valuation methodologies you absolutely need to know:
- Discounted Cash Flow (DCF): A way to value a company based on the cash it’s expected to generate in the future.
- Comparable Company Analysis: Benchmarking a company against similar publicly traded peers.
- Precedent Transactions: Looking at what buyers paid for similar companies in past deals.
Getting a firm grip on these concepts is the key to crushing finance interviews and building a successful career in the M&A world.
Decoding the Core M&A Valuation Methodologies

Successful mergers and acquisitions valuation isn’t about finding a single magic number. It's about building a defensible case for a company’s worth from multiple angles. Think of yourself as a detective, gathering different types of evidence to arrive at the most logical conclusion.
Each valuation method offers a unique lens through which to view a company, and when used together, they create a much clearer and more complete picture. The three foundational pillars that every M&A professional absolutely must master are Discounted Cash Flow (DCF), Comparable Company Analysis, and Precedent Transaction Analysis.
Discounted Cash Flow Analysis: The Intrinsic View
Discounted Cash Flow (DCF) analysis gets right to the heart of what a business is fundamentally worth. It strips away market noise and asks a simple question: "What is this business worth today, based purely on the cash it’s expected to generate in the future?"
Think of it like buying an orchard. You wouldn't just value the land and the trees; you'd be buying the rights to all the future apple harvests. A DCF model does the same for a business—it projects future cash flows and then "discounts" them back to what they're worth in today's money.
A DCF model is powerful because it's grounded in the company's fundamental ability to generate cash, independent of market whims. However, it's also a classic "garbage in, garbage out" scenario; its accuracy lives and dies by the quality of your assumptions.
The process boils down to two main components:
- Forecasting Free Cash Flow (FCF): This is the actual cash left over after a company pays for its operations and investments. Analysts typically project this out for a 5 to 10-year period.
- Calculating the Terminal Value: Since a healthy company doesn't just stop existing after 10 years, the terminal value is a crucial estimate of its worth for all the years beyond the explicit forecast.
All that future cash is then discounted back to the present day using the Weighted Average Cost of Capital (WACC), which accounts for both the time value of money and the riskiness of the investment.
Comparable Company Analysis: The Market View
While DCF analysis looks inward, Comparable Company Analysis (or "Comps") looks outward at what the public market thinks. This method values a company by benchmarking it against similar, publicly traded businesses.
The best analogy is residential real estate. How do you price a three-bedroom house? You look at what other three-bedroom houses in the same neighborhood are currently listed for. Comps apply that exact logic, but instead of price per square foot, investment bankers use valuation multiples.
The first step is identifying a "peer group"—a curated list of companies that are genuinely similar in industry, size, and growth prospects. From there, you calculate key valuation multiples for each company in the group.
Some of the most common multiples include:
- Enterprise Value / EBITDA: A workhorse multiple in finance because it ignores differences in capital structure and tax rates, making for a cleaner comparison.
- Price / Earnings (P/E): A classic metric that tells you how much investors are willing to pay for every dollar of a company's profit.
- Enterprise Value / Revenue: Often the go-to multiple for fast-growing companies that aren't yet profitable, like many tech startups.
You then take the average or median multiple from this peer group and apply it to the target company’s financial metric to arrive at an implied valuation.
Precedent Transaction Analysis: The M&A View
Precedent Transaction Analysis takes the market-based approach one step further. It doesn't just look at how similar companies are trading today; it looks at what buyers have actually paid to acquire similar companies in the past.
Back to our real estate analogy, this isn't about listing prices—it's about the final sale prices of recently sold homes. This method is incredibly relevant for mergers and acquisitions valuation because it reflects the real-world prices that strategic and financial buyers were willing to shell out.
A critical element baked into this analysis is the control premium. This is the extra amount an acquirer pays over a company's public market value to gain full control of the business. Because precedent transactions inherently include this premium, this method often yields the highest valuation range of the three core methodologies.
Bringing It All Together: A Valuation Spectrum
Valuation is an art as much as a science, and no single method gives a perfect answer. In fact, studies from respected sources like the Harvard Business Review have shown that up to 83% of M&A deals fail to create shareholder value, often because of a flawed valuation. This statistic alone underscores the danger of relying on a single number.
To help clients make sense of it all, bankers summarize the outputs from these different methodologies in a visual chart, famously known as a "Football Field." This chart displays the valuation range from each method, providing a clear and comprehensive view that serves as the foundation for negotiation.
Here's a quick rundown to help you keep the core methods straight.
Comparison of Core M&A Valuation Methods
| Methodology | Core Concept | Pros | Cons |
|---|---|---|---|
| Discounted Cash Flow (DCF) | Values a company based on the present value of its projected future cash flows. | Intrinsic, not swayed by market volatility. Forces detailed thinking about business drivers. | Highly sensitive to assumptions (growth rates, WACC). Terminal value can be a huge part of the total. |
| Comparable Companies ("Comps") | Values a company by comparing it to similar publicly traded companies. | Based on live, real-world market data. Easy to calculate and understand. | Finding truly comparable companies is hard. Can reflect market over/undervaluation. |
| Precedent Transactions | Values a company based on what acquirers have paid for similar companies in the past. | Reflects actual deal values, including control premiums. Most relevant for M&A scenarios. | Past transactions may not reflect current market conditions. Data can be hard to find and messy. |
By triangulating the results from DCF, Comps, and Precedent Transactions, analysts can build a robust and defensible valuation range. It's this blended approach—not a single, rigid calculation—that provides the confidence needed to advise on multi-million or multi-billion dollar deals.
Diving Into Advanced LBO and Merger Models
While the core valuation methods give you a solid starting point, some deals require more specialized tools. When you're in the trenches with a private equity fund or a corporate development team, you need models that answer very specific questions about returns and financial impact.
This is where the Leveraged Buyout (LBO) model and the Merger Model come in. They aren't really about finding a company's standalone value. Instead, they’re designed to stress-test the actual mechanics of a deal. For anyone serious about a career in investment banking or private equity, mastering these is non-negotiable.
The Leveraged Buyout (LBO) Model Explained
The Leveraged Buyout (LBO) is the bread and butter of any private equity (PE) firm. The best way to think about it is like buying an investment property with a big mortgage. You’re not planning to live there forever. The plan is to use the rent to pay down the mortgage, maybe fix the place up, and then sell it for a nice profit down the line.
In an LBO, the PE firm does the same thing but with a company, using a ton of debt to finance the purchase. The company's own cash flow is then put to work servicing and paying down that debt over a typical 3-7 year holding period. The entire investment boils down to one critical metric: the Internal Rate of Return (IRR).
An LBO model doesn't really tell you what a company is worth. Instead, it solves for the maximum price a PE firm can pay for a business while still hitting its target IRR, which is often in the 20-30% ballpark.
In that sense, an LBO is almost like a valuation in reverse. You start with your desired outcome (the exit) and work backward to figure out what you can afford to pay today.
The magic of a successful LBO comes from three key drivers:
- Deleveraging: This is the most straightforward part. The company's cash flow pays down the acquisition debt, which automatically increases the equity value owned by the PE firm.
- EBITDA Growth: This is all about operations—making the business more efficient to grow its earnings. A bigger EBITDA at the time of sale translates directly to a higher exit price.
- Multiple Expansion: This means buying the company at, say, a 10x EBITDA multiple and selling it at 12x. It's a powerful lever but also the most unpredictable and riskiest of the three.
To see how these moving parts come together in practice, walking through a detailed private equity case study can make the whole process click.
Breaking Down the Merger Model & Accretion/Dilution
If the LBO is the tool of a financial buyer like a PE firm, then the Merger Model is the go-to for a strategic corporate acquirer. Also known as an Accretion/Dilution analysis, you can think of it as the financial "pre-nup" for a corporate marriage.
Its purpose is brutally simple: to see how the acquisition will impact the buyer's Earnings Per Share (EPS). This one number can make or break a deal because it's what shareholders and Wall Street care about most.
The outcome of the analysis puts the deal into one of two buckets:
- Accretive: The deal is a winner. The combined company's EPS is higher than what the acquirer's would have been on its own.
- Dilutive: This is a red flag. The combined EPS is lower, which often signals to the market that the buyer overpaid or the deal doesn't make financial sense.
The analysis itself is a detailed pro-forma exercise. You're essentially bolting the two companies' income statements together and then making a series of critical adjustments based on how the deal is structured.
The key adjustments in a merger model are:
- Financing Costs: You have to account for the interest on any new debt raised to fund the purchase.
- New Shares Issued: If the acquirer is paying with its own stock, you have to factor in the new, higher share count.
- Synergies: This is where you add in the anticipated cost savings or new revenue opportunities that the merger is supposed to create.
The importance of this analysis is clear in the current market. In 2025, for instance, M&A activity in financial services shot up to $418.9 billion, a massive increase from the prior year as firms paid big premiums for top-tier assets. In consulting interviews, it's common to get a case study asking you to model the accretion or dilution effects of these kinds of high-stakes deals. EY.com has a great report detailing this trend if you want to dig deeper.
At the end of the day, an accretion/dilution analysis is a gut check. A deal that is clearly accretive is an easy story to sell to the board and to the market. A dilutive one? That requires a much more compelling strategic narrative to get everyone on board.
How Synergies and Adjustments Shape Deal Value
A company's standalone valuation is really just the starting point in the high-stakes game of dealmaking. The true art of mergers and acquisitions valuation isn't just about finding what a company is worth today; it's about justifying the final price paid, which almost always comes down to the powerful force of synergies.
Synergies are the secret sauce of M&A—the famous "1 + 1 = 3" effect. This is the core belief that an acquirer can do more with a target's assets than the target could on its own. These potential gains are the number one reason acquirers pay a hefty premium over the market price and are the heart of every deal's story.
The Two Flavors of Synergies
But "synergies" isn't just a buzzword; the concept breaks down into two very different categories. Getting the distinction right is crucial for assessing a deal's real potential because analysts and investors treat them with completely different levels of skepticism.
-
Cost Synergies are the more believable and concrete of the two. They come from chopping out redundant costs once two companies merge. Think of it as trimming the fat: consolidating headquarters, shutting down duplicate warehouses, or merging overlapping IT departments.
-
Revenue Synergies are all about boosting top-line growth. This is the exciting stuff, like cross-selling products to each other's customers or combining technologies to create a brand-new, market-leading offering.
While the potential for revenue synergies can be huge, they are notoriously tough to pull off. They depend on things you can't control, like customer behavior and market trends, which makes them highly speculative. That's why seasoned M&A pros always lean more heavily on well-defined cost synergies when building their valuation models.
Sizing Up Cost Synergies
Analysts put cost synergies under a microscope because, unlike revenue synergies, they're largely within the company's control. The process is all about methodically identifying specific areas where overlap can be eliminated.
Common sources include:
- Headcount Reduction: Removing duplicate corporate roles in departments like finance, HR, and legal is often the single largest source of savings.
- Purchasing Power: A bigger, combined entity can throw its weight around and negotiate much better prices from suppliers.
- Consolidating Operations: Closing down redundant offices or manufacturing plants is a straightforward path to improving efficiency.
In M&A, hope is not a strategy. Cost synergies are valued because they can be mapped out, quantified, and executed with a degree of certainty. Revenue synergies are often treated as a bonus—nice if they happen, but not something you bet the deal on.
Beyond Synergies: Transaction Adjustments
Synergies might be the main event, but several other adjustments are critical to landing on a final deal value. These factors are essential for making sure the valuation reflects the total economic reality of the transaction. Before any deal closes, a deep dive using a thorough Mergers and Acquisitions Due Diligence Checklist is vital to uncover any hidden surprises that could affect these numbers.
The two biggest adjustments are the control premium and transaction costs. The control premium is simply the amount an acquirer pays above the target's standalone market price to gain control. This premium, often in the 20% to 40% range, is explicitly justified by the expected value of the synergies the acquirer plans to unlock.
Finally, you can't forget about transaction costs. These are the real-world expenses of getting a deal across the finish line, including fees for investment bankers, lawyers, and accountants. These costs chip away at the net value gained from the deal and have to be built into the overall financial model. To see how all these pieces fit together in practice, checking out a real-world https://soreno.ai/articles/merger-and-acquisition-case-study can offer incredible insight.
A Step-By-Step Guide to Building Your Valuation Model
Let’s get our hands dirty. Turning valuation theory into a tangible model is where the real learning kicks in. This section is a practical, step-by-step walkthrough for building a Discounted Cash Flow (DCF) model—the true workhorse of mergers and acquisitions valuation. We'll move through each stage methodically, giving you a clear framework you can use for practice or your next interview.
To make this feel real, let's pretend we're valuing a high-growth software company. Our mission is to figure out its intrinsic value by looking at the cash it can generate in the future. It’s a process of forecasting, discounting, and finally, piecing together the valuation puzzle.
If you want a deeper dive into the mechanics of building financial models from scratch, our guide on how to build financial models is a great next step.
This simple flowchart shows how we combine a company's standalone value with the expected synergies from a deal to land on the final transaction value.
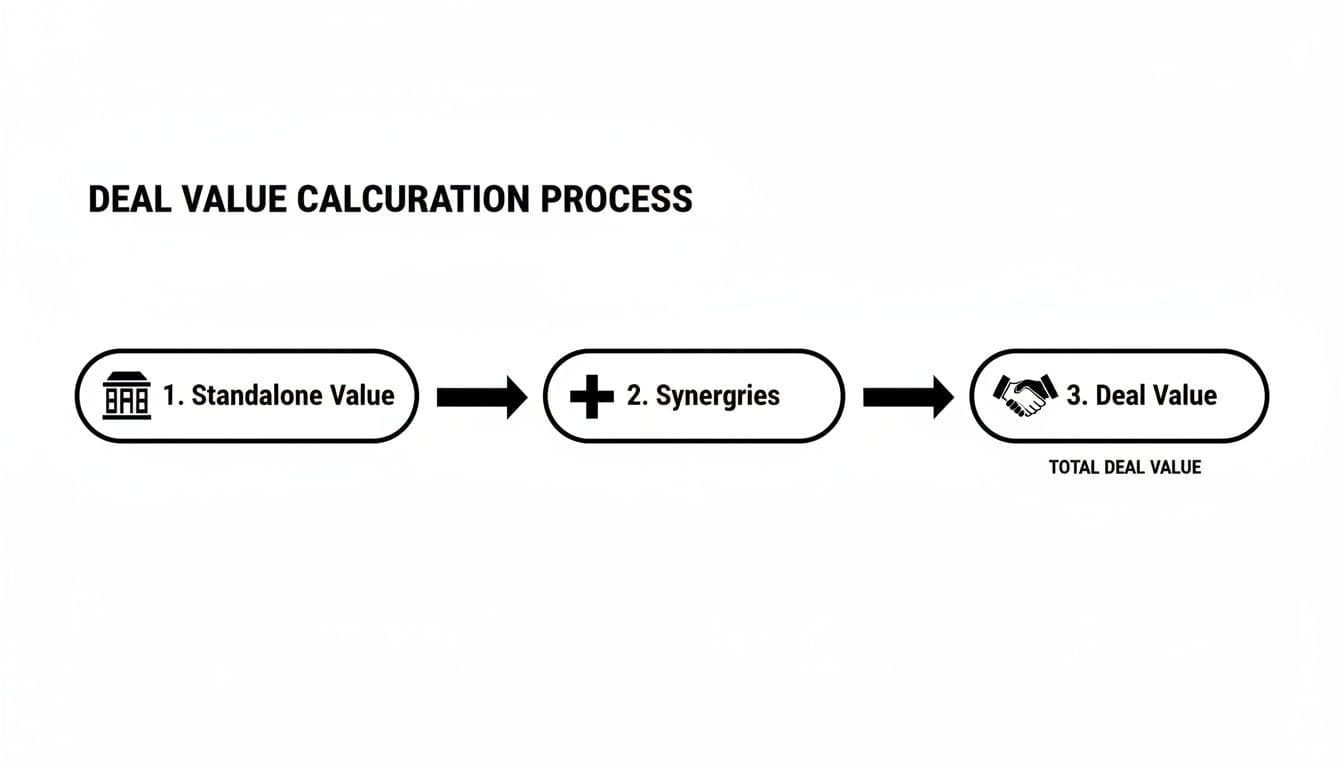
As you can see, the final price tag is more than just what the company is worth today; it’s a strategic bet on the future value the combined entity will create.
Forecasting Free Cash Flows
First things first: we need to project the company's Unlevered Free Cash Flow (UFCF). This is the cash generated by the core business before any debt payments are considered. We typically do this for a forecast period of five to ten years.
You'll start by digging into the historical financials to build a set of realistic, defensible assumptions about what the future holds.
Here are the key drivers you need to forecast:
- Revenue Growth: Where is the market headed? How does the company stack up against competitors? What new products are in the pipeline?
- Profit Margins (EBITDA & EBIT): How good is the company at turning a dollar of revenue into actual profit? Will this improve or decline?
- Capital Expenditures (CapEx): What investment is needed in physical assets (like servers or buildings) to support the forecasted growth?
- Changes in Net Working Capital: How much cash will be tied up in day-to-day operations as the company grows?
Getting these assumptions right is everything. A small tweak here can send massive ripples through your final valuation number, so this step deserves the most scrutiny.
Calculating the Terminal Value
A great business doesn't just stop creating value after year 10. We need a way to capture its worth for all the years beyond our detailed forecast. That's the job of the Terminal Value.
Believe it or not, this single number often accounts for a huge chunk—sometimes over 70%—of the company's total Enterprise Value.
There are two classic ways to calculate it:
- Perpetuity Growth Method: You assume the company’s cash flows will grow at a slow, stable rate (like inflation) forever into the future.
- Exit Multiple Method: You assume the company is sold at the end of the forecast period for a multiple of its final year's EBITDA, much like you'd see in a Comparable Company analysis.
Smart analysts calculate it both ways. It's an essential cross-check to make sure your assumptions aren't out of line.
Determining the Discount Rate
Okay, so now you have a stream of future cash flows—both from the forecast period and the terminal value. But a dollar tomorrow isn't worth the same as a dollar today. We need to bring all that future cash back to its present value.
We do this using a discount rate, and the industry standard is the Weighted Average Cost of Capital (WACC).
WACC is the blended cost of a company's financing from both its equity and debt holders. It's the answer to a critical question: "What's the minimum return investors demand to compensate them for the risk of putting their money in this company?"
A higher WACC means more perceived risk, which in turn leads to a lower present value for those future cash flows. This isn't just an academic exercise; global economic shifts have a huge impact here. Think about the M&A market in 2025—we saw a resurgence in megadeals, with 63 transactions topping $10 billion. Valuations in the U.S. climbed while those in Europe and Asia dipped, all because of different economic forecasts and risk perceptions that flow directly into WACC calculations.
Answering Your Toughest M&A Valuation Questions
Knowing the theory is one thing. Nailing the answers when you're under the gun in a high-stakes M&A interview is something else entirely. This is where your real understanding of valuation gets put to the test. Let's walk through some of the toughest questions that can trip people up, so you can answer them like a seasoned pro.
Think of this as your final round of sparring before the main event. Getting these concepts down cold will give you the confidence to show them you know your stuff when it counts.
Which Valuation Method Consistently Gives the Highest Value?
There's no single rule that applies 100% of the time, but if I had to bet, I'd put my money on Precedent Transaction Analysis. Why? It's the only method that automatically bakes in a control premium—that extra amount a buyer pays to get full control of a company.
Comparable Company Analysis, on the other hand, just shows you what the public markets think a minority stake is worth on any given day. And a DCF? That's a blank slate. Its value is entirely driven by the assumptions you plug into it.
A DCF's output can swing wildly depending on whether your forecasts are bullish or bearish. In a hot M&A market, precedent transactions will naturally be high. In a raging bull market for stocks, comps might look inflated. This is exactly why you always see the "Football Field" chart—it lays out the valuation ranges from every method, giving you the complete picture instead of just one data point.
What Is a Control Premium and How Do You Justify It?
Simply put, a control premium is the difference between what an acquirer pays for a company and where its stock was trading before the deal was announced. It’s the price of getting into the driver's seat—the power to dictate strategy, control the cash flows, and manage the assets.
So, how do buyers justify paying more than the market price? Synergies. That's the whole game. They believe that by taking control, they can unlock value the company couldn't on its own.
You calculate it like this: ((Offer Price Per Share / Pre-Announcement Stock Price) - 1). For instance, if a stock is at $20 and a buyer comes in with a $26 offer, that's a 30% control premium. That 30% isn't just a random number; it's justified by the financial benefits the buyer expects to realize from cost savings, new revenue opportunities, and other strategic moves they can make once the deal is done.
How Do You Bridge from Enterprise Value to Equity Value?
This is one of the most fundamental concepts in all of finance, so you have to know it cold. Enterprise Value (EV) is the total value of a company’s core business operations, belonging to all capital providers (that means both lenders and shareholders). Equity Value, however, is the slice of that value that belongs only to the shareholders.
Getting from one to the other is a simple bridge:
Equity Value = Enterprise Value - Net Debt
What's Net Debt? It's just the company's total debt minus its cash. You subtract debt because those lenders have first claim on the company's assets—they get paid before shareholders see a dime. And why subtract cash? Because it's a non-operating asset, and the thinking is you could use it to pay down the debt immediately. In more complex scenarios, you’ll also see adjustments for things like preferred stock or minority interest.
Why Is a DCF Model Often Called Unreliable?
The greatest strength of a Discounted Cash Flow (DCF) model is also its biggest weakness: it's incredibly sensitive to your assumptions. A tiny change to one input can send the final valuation swinging wildly, which is why people often question its reliability.
It's the classic "garbage in, garbage out" problem.
The three inputs that will move the needle the most are:
- Cash Flow Growth Rates: Let's be honest, predicting a company's financial performance years into the future is more art than science. It's highly speculative.
- The Discount Rate (WACC): Even a small tweak to your WACC has a massive inverse effect on the present value of all those future cash flows.
- The Terminal Value: This single number can easily account for over two-thirds of the entire DCF valuation. The assumptions behind it carry an enormous amount of weight.
Because it's so sensitive, a DCF should never be your only tool. It's one piece of the puzzle, and it should always be presented with a sensitivity analysis showing how the valuation changes under different scenarios.
Ready to ace your finance and consulting interviews? Soreno is your AI-powered training partner, offering a library of 500+ cases and 80 guided drills in an interactive mock interview environment. Get rubric-based feedback, pinpointed notes, and unlimited practice to build the skills and confidence you need to land the offer. Start your free trial at https://soreno.ai.