Present Value Discounting: Master the Skill for Finance Interviews
Learn present value discounting with clear formulas, NPV insights, and practical examples to ace finance interviews.

At its core, present value discounting is a simple idea: a dollar in your hand today is worth more than a dollar you're promised in the future. This isn't just a financial theory; it's a fundamental truth that drives corporate valuation, investment analysis, and major strategic decisions. It's the "why" behind almost every number in finance.
Why a Dollar Today Is Worth More Than a Dollar Tomorrow
Let's say someone offers you a choice: $100 today or $105 a year from now. Even though the future amount is larger, your gut probably tells you to take the $100 now. That instinct is spot on, and it's not about being impatient—it's about smart financial thinking.
The process of present value discounting is what turns this intuition into a reliable, analytical tool. It’s a concept you absolutely must master for any finance or consulting interview.

This isn't some abstract academic exercise. It's the foundation for multi-billion dollar decisions made every day at firms like McKinsey, Bain, Goldman Sachs, and KKR. The reason money is more valuable now comes down to two key factors.
The Power of Opportunity and Risk
First, you have opportunity cost. That $100 you get today isn't just sitting there; it can be put to work. You could invest it in a savings account earning 5% interest. In one year, it would grow to $105—the same amount as the future offer. By taking the money now, you capture the opportunity for it to earn more.
Second, there's risk and uncertainty. A promise to pay you in the future is just that—a promise. The person or company might default. The economy could tank. Inflation might spike, making that future $105 buy less than $100 does today.
The core idea is simple yet powerful: future cash flows are inherently less valuable than present ones because of the earning potential (opportunity) and the uncertainty (risk) that lie between today and tomorrow.
Getting a handle on this is non-negotiable if you're serious about a career in finance or consulting. It's the tool you'll use constantly for:
- Valuing Companies: Figuring out what a business is worth today based on the profits it's expected to generate years from now.
- Evaluating Projects: Determining if building a new factory or launching a new product makes financial sense.
- Making Strategic Recommendations: Justifying a merger, acquisition, or new market entry by showing its long-term value in today's dollars.
By mastering present value discounting, you learn how to translate a fuzzy future into a hard number you can act on today.
Decoding the Present Value Formula
At the heart of discounting is a simple but powerful formula that translates future money into today's worth. This isn't just about memorizing variables for an interview; it's about internalizing the logic that drives every single valuation you'll ever do.
The formula is: PV = FV / (1 + r)^n
Let's unpack what each piece of this really means and how they work together.

While it looks modern, this concept has a surprisingly long history. The core idea of discounting future payments back to the present started centuries ago, born out of necessity for merchants trying to compare different investment opportunities. The earliest known problem of this type was actually posed and solved by Leonardo of Pisa—you probably know him as Fibonacci—all the way back in his 1202 work Liber Abaci. It's a foundational concept that set the stage for modern finance. If you're curious, you can explore more of this financial history on Freakonometrics.
Breaking Down the Variables
To use this formula with any confidence, you have to know what each component represents. Think of it like a recipe where every ingredient plays a critical role.
- PV (Present Value): This is what you're trying to find—the value of a future sum of money in today’s dollars. It's the acorn you're starting with.
- FV (Future Value): This is the lump sum of money you expect to get at some point down the road. It’s the full-grown oak tree your acorn will become.
- r (Discount Rate): This is the rate of return you could be earning on an investment with similar risk. It represents both your opportunity cost and the risk involved, sort of like the quality of the soil for your growing tree.
- n (Number of Periods): This is simply the number of years (or other periods, like months) until you receive the cash. It's the number of growing seasons.
By dividing the Future Value (FV) by the compounded discount factor (1 + r)^n, you are systematically stripping out the earnings potential and risk that are tied to time. This process brings that future amount back to what it’s worth in your hand today.
A Step-by-Step Calculation Example
Let's make this real. Imagine you're promised $1,000 five years from now. After considering the risks, you decide that a 7% discount rate is appropriate.
Here’s how you'd figure out its present value:
-
Identify Your Variables:
- FV = $1,000
- r = 7% (or 0.07)
- n = 5 years
-
Plug Them into the Formula:
- PV = $1,000 / (1 + 0.07)^5
-
Calculate the Denominator:
- First, calculate the value inside the parentheses raised to the power of 5: (1.07)^5 ≈ 1.40255.
-
Solve for Present Value:
- PV = $1,000 / 1.40255 ≈ $712.99
So, what does this mean? That promise of receiving $1,000 in five years is only worth $712.99 to you today, assuming you could otherwise earn 7% annually. Mastering this simple calculation is the first, most crucial step toward tackling complex business valuations.
This relationship is intuitive: the higher the discount rate (more risk or better alternatives) and the longer the wait, the less that future money is worth today.
The table below illustrates this perfectly. Notice how the present value of $1,000 shrinks as both the time and the discount rate increase.
Impact of Discount Rate and Time on $1000 Future Value
| Years (n) | PV at 3% Discount Rate | PV at 7% Discount Rate | PV at 10% Discount Rate |
|---|---|---|---|
| 1 | $970.87 | $934.58 | $909.09 |
| 5 | $862.61 | $712.99 | $620.92 |
| 10 | $744.09 | $508.35 | $385.54 |
| 20 | $553.68 | $258.42 | $148.64 |
| 30 | $411.99 | $131.37 | $57.31 |
As you can see, a $1,000 payment in 30 years is worth a respectable $411.99 with a low-risk 3% rate, but it's worth a paltry $57.31 if the discount rate is 10%. Time and risk are powerful forces.
How to Select the Right Discount Rate

While the present value formula is pure math, choosing the discount rate is where the real analysis happens. It’s more art than science—a careful blend of logic, reasoned assumptions, and solid justification. Get this part wrong, and your entire valuation can crumble.
This is exactly why interviewers love to poke and prod at your choice of discount rate. It reveals how you think about risk.
So, what is it, really? Think of the discount rate as the opportunity cost for an investor. It’s the return they would demand from an investment with a similar risk profile. The higher the perceived risk, the higher the return they'll expect, which translates directly into a higher discount rate.
To arrive at a defensible number, analysts don't just pull a rate out of thin air. Instead, they build it piece by piece, starting with a baseline and layering on different risk premiums. This structured approach is key to justifying the final figure used in your present value discounting model.
The Building Blocks of a Discount Rate
At its heart, any discount rate is constructed from a few fundamental components. Nailing these down is crucial for explaining your logic.
- Risk-Free Rate: This is your foundation. It’s the return you could expect from a "zero-risk" investment, almost always benchmarked to a long-term government bond like the 10-year U.S. Treasury.
- Equity Risk Premium (ERP): This is the extra return investors demand for taking on the general risk of the stock market compared to the safety of a government bond. It's the price of admission for playing in the equities game.
- Company-Specific Risk: Here’s where the "art" really comes into play. This premium accounts for all the risks unique to the company you’re analyzing—its size, the stability of its industry, its competitive moat, and even its operational leverage.
The discount rate is ultimately a story about risk. It translates qualitative business risks—like market competition, regulatory hurdles, or technological disruption—into a quantitative figure that directly impacts the company's present value.
WACC: The Corporate Standard
When you’re valuing an entire company, the go-to discount rate is the Weighted Average Cost of Capital (WACC). This isn't just about what shareholders expect; WACC represents the company's blended cost of capital from all sources, including both equity (shares) and debt (loans and bonds).
Using WACC is critical because it captures the total risk profile of the business from the perspective of both its owners and its lenders. A rock-solid valuation often hinges on your mastery of the WACC calculation. To build that skill, it's worth reviewing key financial modeling best practices that keep your analysis sharp and defensible.
Case Study: Comparing Risk Profiles
Let's see how this works with two wildly different companies.
- A Stable Utility Company: This business is a model of predictability. It has steady cash flows, a captive market thanks to regulation, and consistent demand. Its risk profile is low, so its WACC might land somewhere in the 5-7% range.
- A High-Growth Tech Startup: This company is the polar opposite. It’s navigating a volatile market, burning cash, facing down fierce competitors, and has a highly uncertain future. The risk profile is sky-high, so an appropriate discount rate could easily be 20-30% or even more.
The impact of this difference is staggering. A projected $10 million cash flow a decade from now is worth $5.58 million today at a 6% discount rate. But at a 20% rate, it's worth only $1.62 million.
Ultimately, your choice of discount rate is a powerful statement. It tells the world exactly what you think about the fundamental risk of the business.
Calculating Net Present Value for Business Decisions
Business decisions are rarely as simple as weighing a single future payment. In the real world, investments mean laying out cash today for a whole stream of expected returns over many years. This is where present value discounting grows up into a powerhouse strategic tool: Net Present Value (NPV).
NPV analysis is the gold standard for sizing up projects and investments. It’s a beautifully logical process: take all the future cash flows a project is expected to spit out, pull each one back to its value in today's money, and then subtract the initial cost.
Think of it as the ultimate financial scorecard for a big decision.
Interestingly, this idea has roots that go way beyond a corporate boardroom. Back in the 1930s, U.S. engineers started using present value concepts for huge infrastructure projects, which gave birth to modern cost-benefit analysis. Governments today use "social discount rates" to do the same thing—weigh the immediate costs of public works against their long-term benefits for society.
The NPV Decision Rule
Once all the math is done, the NPV gives you a beautifully simple, direct answer. It’s a clear green light or a hard red stop for your investment.
- If NPV > 0 (Positive NPV): The project is expected to generate more value than it costs. Go for it. You're creating value.
- If NPV < 0 (Negative NPV): The project is set to destroy value. Reject it. The returns just don't clear the hurdle set by your initial investment.
- If NPV = 0: The project is projected to earn a return exactly equal to your required rate (the discount rate). It's a wash—you'd be indifferent.
The real magic of NPV is that it boils down a complex series of future earnings and an upfront cost into a single, decisive number. A positive NPV is your signal that the investment should earn a return greater than your required rate of return.
Mini Case Study: Investing in a New Factory
Let's put this into practice with a realistic scenario. Imagine your company is thinking about building a new factory. The upfront cost is a cool $1,000,000. Your team projects it will generate the following after-tax cash flows over the next three years:
- Year 1: $300,000
- Year 2: $500,000
- Year 3: $600,000
Based on the project's risk, you've set the discount rate at 10%. So, should you build it? Let's find the NPV.
1. Discount Each Cash Flow First, we'll pull each year's cash flow back to its present value.
- PV of Year 1 = $300,000 / (1 + 0.10)^1 = $272,727
- PV of Year 2 = $500,000 / (1 + 0.10)^2 = $413,223
- PV of Year 3 = $600,000 / (1 + 0.10)^3 = $450,789
2. Sum the Present Values Next, we add up the discounted cash flows to see what they're worth in total today.
- Total PV = $272,727 + $413,223 + $450,789 = $1,136,739
3. Calculate NPV Finally, subtract the initial investment from the total present value.
- NPV = $1,136,739 - $1,000,000 = $136,739
The result is a positive NPV of $136,739. The analysis gives a clear signal: proceed with the factory. This exact process is the bedrock of building solid financial models for complex business decisions.
Of course, NPV isn't the only tool in the box. Understanding other key metrics like the Internal Rate of Return (IRR) is also crucial. For instance, a real estate IRR calculator is a great way to evaluate the true annualized return of a potential property investment.
Common Discounting Mistakes to Avoid in an Interview
In a high-pressure interview, it's the small details that make you stand out. The core ideas behind present value discounting might seem simple, but it’s surprisingly easy to make subtle errors that can question your whole analysis. Knowing what to watch out for is your best defense.
One of the most common slip-ups is a basic mismatch of periods. You see it all the time: a candidate takes an annual discount rate and applies it directly to quarterly or semi-annual cash flows without making any adjustments. This mistake inflates the present value because it ignores the more frequent compounding.
Mismatched Time Periods
The fix is simple but absolutely critical: always convert your discount rate to match the cash flow frequency. An annual rate of 12%, for instance, doesn't just become 3% per quarter. The correct way to find the effective quarterly rate is to calculate (1.12)^(1/4) - 1, which comes out to about 2.87%. Nailing this detail shows you have a much deeper, more rigorous understanding.
Mixing Real and Nominal Values
Another classic pitfall is mixing and matching real and nominal values. It's a fundamental error. Nominal cash flows have inflation baked in, while real cash flows don't. Your discount rate has to be on the same page.
- Nominal Cash Flows: These must be discounted with a nominal rate, which also includes an inflation premium.
- Real Cash Flows: These must be discounted with a real rate, which has that inflation component removed.
If you discount real cash flows with a nominal rate, you’re essentially double-counting inflation and unfairly punishing the project. This leads to a valuation that's way too low. Being consistent here is absolutely key. To really get a handle on these concepts and more, it's worth building a well-rounded set of financial analyst skills.
The flowchart below gives a bird's-eye view of the correct NPV process, showing how everything flows logically from your forecasts to the final investment decision.
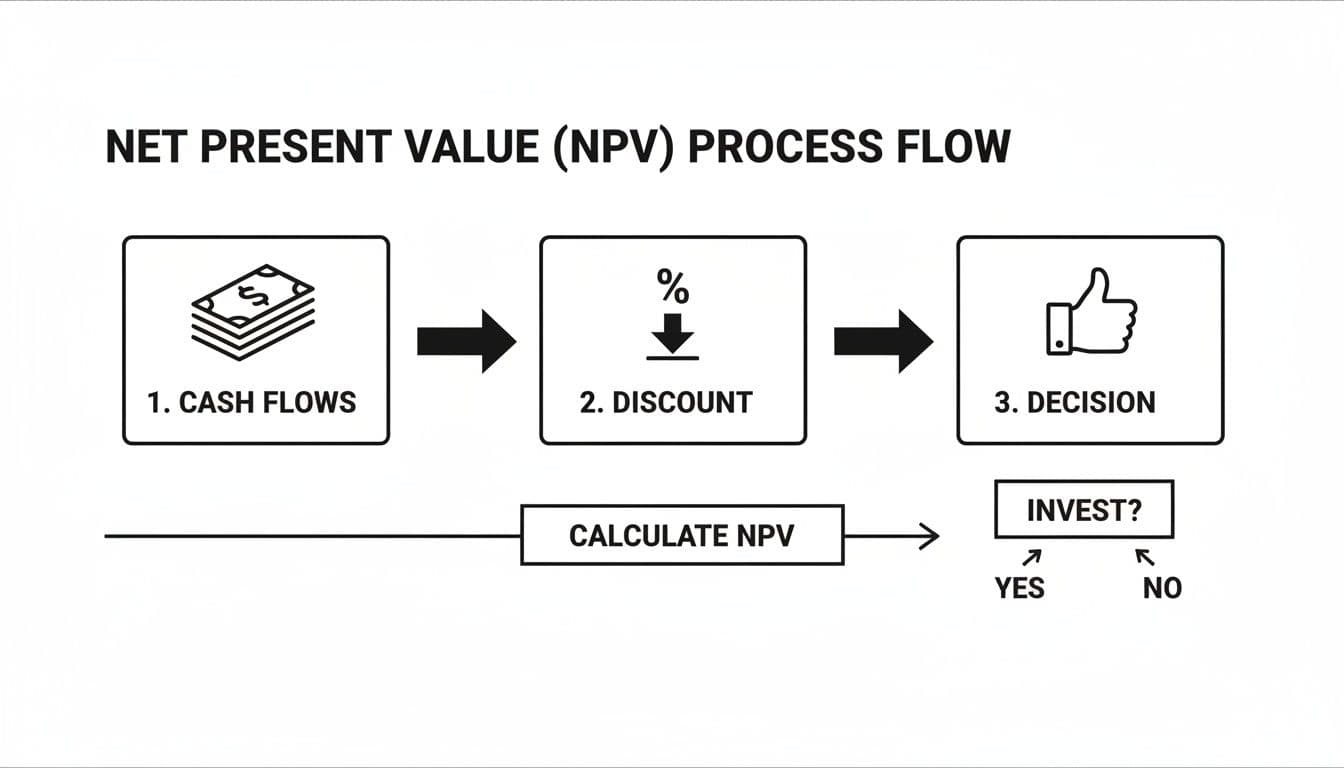
This visual really drives home the point that discounting is the essential link between what you think will happen in the future and the decision you have to make today.
Don’t forget about the terminal value. This calculation often accounts for a massive chunk of a company's total valuation, and even a tiny error in your perpetual growth rate assumption can swing the final NPV by millions.
Always be ready to justify your growth rate. A safe and standard approach is to tie it to long-term GDP growth. For more help navigating these kinds of questions, take a look at these typical finance interview questions and answers. Getting these details right proves you're not just a formula-plugger; you genuinely understand how valuation works.
Putting Your Knowledge to the Test with Practice Problems
Knowing the theory is one thing, but can you apply it under pressure? That's what separates the top candidates from the rest. The only way to get fast and confident with present value discounting is to get your hands dirty with some real problems.
Let's walk through two classic interview-style questions. The first is a quick test of your calculation speed, and the second is a mini-case study that mimics a real-world business decision. I’ll break down the solution for each, explaining not just the math but what it actually means for the business.
Problem 1: The Single Payout
An investor offers you a guaranteed payment of $50,000 four years from today. For an investment with this level of risk, you require an 8% annual return. What’s the absolute most you should pay for this opportunity right now?
Solution Walkthrough
This is a classic present value problem. We just need to figure out what that future $50,000 is worth in today's money.
- Lay out your variables:
- Future Value (FV) = $50,000
- Discount Rate (r) = 8% (or 0.08)
- Number of Periods (n) = 4 years
- Plug them into the formula:
- PV = $50,000 / (1 + 0.08)⁴
- PV = $50,000 / (1.08)⁴
- PV = $50,000 / 1.3605
- Calculate the answer:
- PV ≈ $36,751
The Bottom Line: You shouldn't pay a penny more than $36,751 for this investment today. If you did, your annual return would dip below your required 8%.
Problem 2: The NPV Decision
A company is evaluating a new project. It requires an upfront investment of $200,000. The project is expected to generate the following after-tax cash flows: $70,000 in Year 1, $90,000 in Year 2, and $110,000 in Year 3. The company uses a 12% discount rate for projects like this. Should they move forward?
Solution Walkthrough
For this one, we need to calculate the Net Present Value (NPV) to see if the project creates value.
- Discount each cash flow back to today:
- Year 1 PV: $70,000 / (1.12)¹ = $62,500
- Year 2 PV: $90,000 / (1.12)² = $71,747
- Year 3 PV: $110,000 / (1.12)³ = $78,290
- Add up the present values of the cash inflows:
- Total PV of Inflows = $62,500 + $71,747 + $78,290 = $212,537
- Find the Net Present Value:
- NPV = (Total PV of Inflows) - (Initial Cost)
- NPV = $212,537 - $200,000 = $12,537
The Verdict: Yes, they should absolutely do it. The project has a positive NPV, which means it’s projected to add $12,537 in value to the company over and above its initial cost. It’s a go.
Common Sticking Points: Your Interview FAQ on Discounting
When you're in a technical interview, a few key questions about present value and discounting always seem to pop up. Nailing the details on these can really set you apart.
Let's walk through some of the most frequent points of confusion so you're ready for them.
What's the Real Difference Between Discounting and Compounding?
It's a great question because they're two sides of the very same coin. Think of it as a time-travel concept for money.
-
Compounding is about looking forward. You start with money today and project its growth into the future. It answers the question, "If I invest $100 today, what will it be worth in five years?" It’s all about accumulation.
-
Discounting is about looking backward. You start with a promise of money in the future and pull it back to today to see what it’s worth. This answers, "That $1,000 I'm supposed to get in five years... what's its value in my pocket right now?" This is all about valuation.
So, one moves money forward in time (compounding), and the other brings it back to the present (discounting).
How Do You Estimate a Discount Rate for a Private Company?
This is a classic interview favorite because it tests whether you can think on your feet when the "textbook" data isn't there. Private companies don't have a stock price, so you can't just look up their beta to plug into your WACC formula.
The go-to method is to find a proxy. You identify a group of publicly traded companies—your "comp set"—that are as similar as possible in terms of industry, size, and business model. You then calculate the beta for those public companies and use their average or median as a stand-in for the private company's beta. It's a practical way to ground your assumptions in real-world market data.
When Is It Actually Appropriate to Use a Perpetuity Formula for Terminal Value?
The perpetuity growth model, often called the Gordon Growth Model, is a powerful tool in a DCF, but it comes with a big string attached. It’s used to estimate a company's value from a certain point forward, assuming it will grow at a slow, steady rate forever.
This assumption only holds up for mature, stable businesses with predictable cash flows—think of a giant utility company or a household-name consumer goods brand. It's not for a high-flying tech startup.
Crucially, the growth rate you plug into that formula must be modest and defensible. A rate around the long-term GDP growth rate (2-3%) is standard. Anything higher would imply the company will eventually grow bigger than the entire economy, which is a major red flag in any analysis.
Ready to ace your next finance or consulting interview? Stop leaving your performance to chance. Soreno is your on-demand AI interview coach, trained by MBB consultants to give you the targeted practice you need. Get instant, rubric-based feedback on everything from your case structure to your communication style. Start your free trial today.